With the advent of analytics tools, there is a plethora of digital marketing metrics you can measure. Some of them are important to make further decisions, while others are just "vanity metrics", which don't get you sales.
Today I'd like to present some of the main online marketing metrics we like to consider in our everyday work. Again, if you have any new ideas or advice, feel free to share them in the comment section below.
Table of Contents
What Are Digital Marketing Metrics?
Digital marketing metrics are quantitative measurements used to evaluate and assess the performance of digital marketing campaigns, strategies, and channels. These metrics provide insights into how well your online marketing efforts are performing, whether your goals are being met, and where improvements or adjustments are needed.
Such metrics can cover a wide range of areas, including website traffic, conversion rates, social media engagement, email marketing effectiveness, and more.
Why Are Digital Marketing Metrics Important?
Digital marketing metrics serve as a critical tool for measuring, analyzing, and optimizing your digital marketing efforts. They empower you to make data-driven decisions, improve your marketing strategies, and ultimately achieve better results and ROI in a rapidly evolving digital landscape.
- Performance Evaluation: Metrics provide a way to measure and assess the performance of your digital marketing campaigns and strategies. They allow you to determine whether your efforts are achieving the desired results and meeting your goals.
- Data-Driven Decision-Making: Digital marketing metrics provide actionable data that can inform your marketing strategies. By analyzing the data, you can make informed decisions about where to allocate resources, which tactics to adjust, and which areas require improvement.
- Goal Tracking: They help you track progress toward your specific marketing objectives. Whether your goal is to increase website traffic, boost conversions, or improve brand engagement, metrics allow you to measure how close you are to achieving those goals.
- Optimization: By regularly monitoring online marketing metrics, you can identify areas of your campaigns that are underperforming or not delivering the expected ROI. This enables you to make adjustments, optimize your strategies, and maximize the efficiency of your marketing budget.
- Budget Allocation: Allow you to allocate your marketing budget more effectively. By identifying which channels or campaigns are generating the best results, you can allocate more resources to those areas and reduce spending on less effective strategies.
- Accountability: Metrics provide a basis for accountability within your marketing team or organization. They allow you to assess the performance of individual campaigns, team members, or marketing agencies, holding them responsible for meeting targets.
- ROI Measurement: Digital marketing metrics help you calculate the return on investment (ROI) for your marketing efforts. This is crucial for demonstrating the value of your marketing activities and justifying your budget to stakeholders.
- Continuous Improvement. When you have data to analyze, you can identify what works and what doesn't, leading to ongoing optimization and innovation in your marketing strategies.
- Competitive Analysis: Metrics enable you to benchmark your performance against competitors in your industry. This helps you understand how you stack up against similar businesses and identify opportunities for differentiation.
- Adaptation to Market Changes: Digital marketing metrics can signal changes in customer behavior, market trends, or competitive landscapes. Being attuned to these changes allows you to adapt your strategies and stay competitive.
- Customer Insights: Provide valuable insights into your audience's behavior and preferences. This information can guide your content creation, messaging, and targeting efforts to better resonate with your audience.
- Transparency and Reporting: A basis for transparent reporting to stakeholders, such as executives, clients, or investors. They help you communicate the impact of your marketing efforts in a quantifiable and understandable way.
Digital Marketing Metrics You Should Measure
As mentioned, some metrics are just nice to have (Twitter followers, Facebook likes etc.), as they don't really drive sales to your business.
Others are vital for better marketing decisions, such as: website traffic, top-ranking pages, Click Through Rate (CTR), etc., as, even small changes in these performance metrics, can yield huge results for your customer acquisition.
Website Traffic Metrics
Total Website Traffic

This is NOT a vanity metric, although some of you might ask me "OK, traffic alone doesn't bring me leads". True, random traffic doesn't bring in leads, but, with good SEO in place, decent PPC (if you rely on it), email and social media marketing, you can bring in more people at your virtual door.
It's like opening a store on the main street or somewhere remote. Not all passers-by are going to turn into clients, but, numbers do matter. If you have 1,000 visitors on your website you can turn more of them into clients than if you have 10.
You are tracking this data with Google Analytics and can see reports for various time ranges: daily, weekly, last 28 days, last 12 months etc. Even custom ranges and, more importantly, you can COMPARE data.
This way you can see if a certain month/week was better or worse than the previous ones.
Traffic by Channel
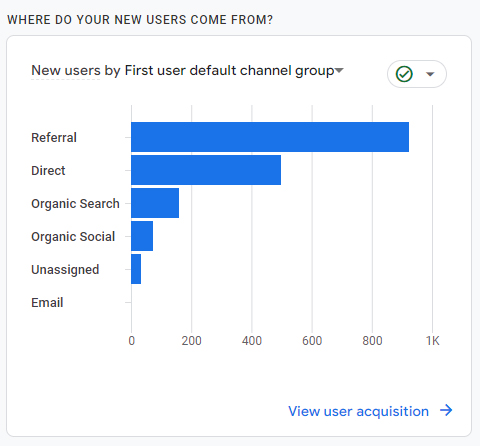
Before we leave Google Analytics, this is another important metric to look at and understand what improvements can change your results for the better.
In this case here is what we read into these stats:
- Referral traffic: visitors coming from the websites that are linking to the client's website.
- Direct traffic: the visitors who type in the domain name and go directly to the website. Like you'd type in ramonajar.com and get here. You would be tracked as a direct source of traffic.
- Organic search: this is my domain, as an SEO. It's the visitors who are searching for your products, services, and brand name and then click on the search results. In this case, as the organic search is no.3 in my list, it's clear the website needs a little more optimization to capitalize on the free search engine traffic.
- Organic social: the website coming from social media posts.
- Email: if you run email marketing campaigns, this is where you see how many visitors you actually get from this strategy.
New vs. Returning Visitors (Retention Overview)

Back in the day, when we used Universal Analytics, you'd find this under the NEW VS RETURNING VISITORS tab, now that we have GA4, it's under a different section (MONETIZATION > RETENTION).
Why does it matter?
If you have a lot of new visitors, you are clearly attracting more eyes on your website. Returning visitors are also important, as these are the ones you already turned into "fans" and are more likely to buy from you.
The returning visitors metric can be easily improved with constant content being published on your website, maybe contests, discounts, etc.
Conversion Metrics
Conversion Rate
Conversion rate, in the world of digital marketing, is a key metric that tells you how effective your efforts are in turning website visitors into desired actions. In simpler terms, it's the percentage of people who take a specific action you want them to, out of everyone who visits your website or encounters your marketing campaign.
Think of it like this: Imagine you're running an online store selling delicious cookies. Your desired action is for people to make a purchase. So, if you have 100 visitors to your website and 10 of them buy cookies, your conversion rate would be 10%.
Now, the specific desired action can vary depending on your goals. Here are some common examples:
- E-commerce websites: Making a purchase
- Lead generation websites: Signing up for a newsletter or downloading a white paper
- Blog websites: Subscribing to the blog or sharing an article on social media
- Social media campaigns: Clicking on a link in your ad or following your page
You can easily set up your goals in Google Analytics and then track your Conversion Rates.
We now move to the online marketing metrics that we use mainly in our SEO work:
Search Engine Optimization (SEO) Metrics
Keyword Rankings

Keyword rankings is one of the most important metrics in digital marketing, as it shows us where our Search Engine work leads us and how we can leverage the FREE Google traffic.
There are other search engines, of course, but, given the huge market share big ole G has, we'll focus mainly on this.
Keywords are the essential building blocks of search engine optimization (SEO) and online marketing. They're the words and phrases people use to search for information, products, or services online. Understanding the different types of keywords can help you optimize your website and marketing efforts for better visibility and results.
Here's a breakdown of some key types of keywords:
By Length:
- Short-tail keywords: 1-3 words, high search volume, high competition ("shoes", "travel").
- Long-tail keywords: 4+ words, more specific, lower competition ("best hiking boots for women", "cheap flights to Paris").
By Search Intent:
- Informational: Seek information ("how to fix a flat tire", "history of the internet").
- Navigational: Find a specific website or page ("YouTube login", "Amazon homepage").
- Commercial: Research products or services ("best laptops for students", "car dealerships near me").
- Transactional: Ready to buy ("buy iPhone 14 now", "book hotel room").
Other Types:
- Seed keywords: Broad starting points for research ("fitness").
- Branded keywords: Include your brand name ("Nike shoes", "Google search").
- Niche keywords: Highly specific to a particular market ("gluten-free vegan baking recipes").
- Local keywords: Include location ("pizza delivery near me", "best dentist in Chicago").
Choosing the right types of keywords depends on your goals. Short-tail keywords can drive high traffic, but long-tail keywords often convert better. Understanding search intent helps you create content that caters to what people are actually looking for.
Organic Traffic
The bread and butter of SEO work, the main metrics we care about, when it comes to optimizing a website. As we don't have control over the quality of products/services the client provides, pricing and company rating, getting them SE traffic is a sure way to increase sales.
SEO is one of the best marketing tactics to employ, as it allows clients to constantly improve on their assets (website, backlinks etc.), while paying a fraction of the advertising costs.
A quick example: fintech company pays for SEO. Their Google traffic alone is worth at least 15K (if they were to pay for PPC ads). The SEO's fee is a small percentage of this budget.
Click-Through Rate (CTR)
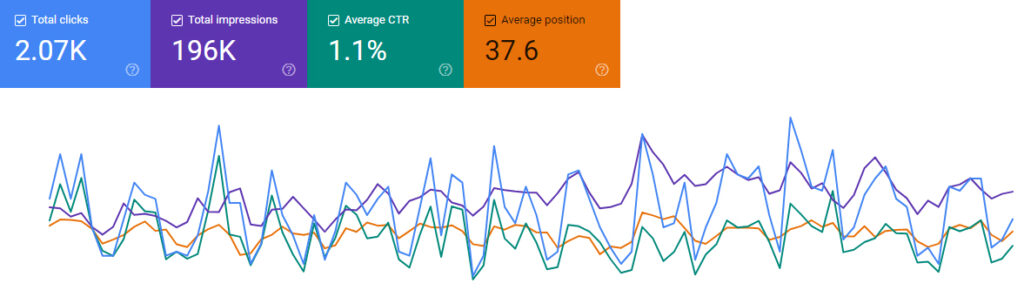
In the context of advertising, CTR measures the percentage of people who click on an ad after seeing it. If your ad received 1,000 clicks from 50,000 impressions, your CTR is 2%.
In Search Engine Optimization, CTR shows the percentage of people who searched for a certain keyword and clicked on your result.
Ideally, you'd wish for at least 5%. If the percentage is lower you'll need to do the following:
- improve rankings: you cannot get clicks, if your result appears on page 5 in the search engine.
- improve meta titles and descriptions: once you hit page 1, your meta tags should be compelling, to make visitors click on your search result.
Since I don't like to do the same work twice, our optimization process takes care of everything at once (images, meta tags, content, internal linking etc.). This way, you are going to rank high and also improve your Click Through Rate.
Backlink Quality and Quantity
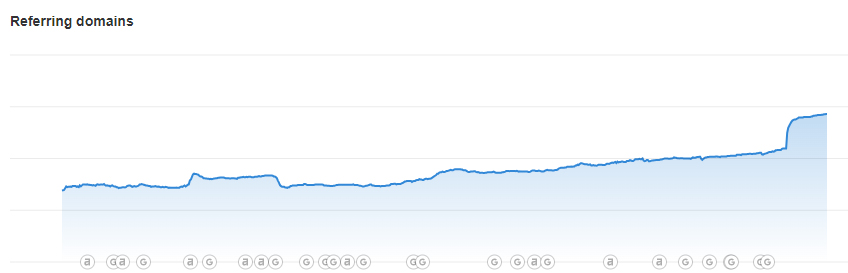
For our SEO clients, one of our monthly checks is their backlink status. In some cases, there is negative SEO performed by competitors (which can affect a website, no matter the official Google stance on this). In other cases, there are SEO companies who are performing shoddy backlink strategies, which in turn can hurt their clients.
Keeping a steady growth in your backlink profile and aiming for good quality links is vital for ranking in some of the more competitive niches. Domain authority/rating is still a direct ranking factor, and having many great quality domains linking to your website is a sure way to get a better authority in the niche.
Cost per Lead (CPL)
This metric shows the cost of acquiring a new lead through your marketing efforts.
Customer Lifetime Value (CLV)
Email Marketing Metrics
Open Rate
Open rate in email marketing is a key metric that tells you what percentage of recipients actually opened your email. It's expressed as a percentage and calculated by dividing the number of unique opens by the total number of emails sent, then multiplying by 100.
For example, if you sent 100 emails and 25 were opened, your open rate would be 25%.
Importance of Open Rate
- Measures initial engagement: It's like the first hurdle in your email campaign, indicating if your subject line and sender name piqued your audience's interest enough to open.
- Benchmarks and comparison: Compare your open rate to industry averages or your own historical data to gauge performance and identify areas for improvement.
- Predicts success: A higher open rate generally suggests better engagement and potentially higher conversion rates for your email campaign goals (clicks, purchases, etc.).
Factors Affecting Open Rate
- Subject line: Catchy, relevant, and personalized subject lines can significantly increase open rates.
- Sender name: Using a recognizable and trustworthy name can boost open rates.
- Time of day and day of week: Sending emails when your audience is likely to be active can improve open rates.
- Email list quality: Maintaining an engaged and relevant email list is crucial for good open rates.
- Mobile-friendliness: Many emails are opened on mobile devices, so optimizing your emails for mobile viewing is essential.
Average Open Rates
- Across industries, the average email open rate is around 20-25%.
- Email marketing benchmarks vary by industry, with higher rates for niches like government, hobbies, and religion.
Improving Open Rates
- Experiment with different subject lines and sending times.
- Segment your email list for targeted content and personalization.
- Use preheader text to add context and intrigue about your email content.
- Clean your email list to remove inactive subscribers.
- Follow email marketing best practices for deliverability and engagement.
Conversion Rate from Email Campaigns
The conversion rate from email campaigns is a dynamic metric that can vary greatly depending on several factors. It essentially tells you what percentage of recipients who opened your email took the desired action. This could be anything from making a purchase to subscribing to a newsletter to downloading a resource.
Average Conversion Rates
- Across industries, the average conversion rate for email campaigns is around 2-5%. However, this is just a general benchmark and can be much higher or lower depending on specific factors.
- Industry benchmarks differ significantly.
Unsubscribe Rate
The unsubscribe rate in email marketing is a crucial metric that tells you what percentage of recipients choose to opt out of your mailing list. This means they no longer want to receive emails from you. It's expressed as a percentage and calculated by dividing the number of unique unsubscribes by the total number of emails sent, then multiplying by 100.
For example, if you sent 1,000 emails and 25 people unsubscribed, your unsubscribe rate would be 2.5% (25 / 1,000 x 100).
Importance of Unsubscribe Rate
- Measures disengagement: Indicates how many recipients aren't finding your emails valuable or relevant.
- Impacts reputation and deliverability: High unsubscribe rates can flag your emails as spam, affecting future deliverability.
- Signals opportunities for improvement: Provides insights into why people are opting out and can help you refine your email strategy.
Average Unsubscribe Rates
- Across industries, the average unsubscribe rate for email campaigns is around 2%. However, this is just a general benchmark and can vary depending on several factors like industry, list quality, and email quality.
- Industry benchmarks range from around 1% for B2B services to 3-5% for e-commerce.
Factors Affecting Unsubscribe Rate
- Email frequency: Sending too many emails can overwhelm recipients and lead to unsubscribes.
- Irrelevant content: Emails that don't resonate with your audience's interests or needs are likely to be unsubscribed from.
- Poor design and format: Unprofessional-looking emails or difficult-to-read formats can deter engagement and lead to unsubscribes.
- Deceptive subject lines or unsubscribe process: Bait-and-switch tactics or complicated unsubscribe procedures can frustrate recipients and prompt them to opt out.
Email List Growth Rate
Email list growth rate is a key metric in email marketing that tells you how quickly your email list is increasing or decreasing in size over time. It helps you understand the effectiveness of your list-building efforts and the overall health of your mailing list.
Calculating Email List Growth Rate
- Determine the period you want to measure: This could be a week, month, quarter, or any other relevant timeframe.
- Calculate the difference in your email list size at the beginning and end of the period.
- Divide the difference by the starting list size.
- Multiply the result by 100 to express it as a percentage.
For example: If you started with 1,000 subscribers and gained 200 new subscribers in a month, your list grew by 20%. If you lost 50 subscribers during the same period, your list growth rate would be 15% (200 new - 50 lost / 1,000 starting size * 100).
Pay-Per-Click (PPC) Advertising Metrics
Cost Per Click (CPC)
Cost Per Click (CPC) is a pricing model in online advertising where you, the advertiser, pay a fee each time someone clicks on your ad. No click, no cost! This makes CPC a highly targeted and transparent way to reach potential customers, as you only pay when someone shows active interest in your offering.
How to Calculate CPC
- Average CPC: This is the total cost of your ad campaign divided by the total number of clicks received. It gives you a general idea of how much you're paying per click on average.
- Actual CPC: This is the specific amount you pay for each individual click. It can vary depending on factors like keyword competition, ad quality, and bidding strategy.
Several factors can influence the cost of your clicks, including:
- Keywords: More competitive keywords, like "buy iPhone 14," will generally have higher CPCs than less competitive ones, like "best hiking boots for women."
- Platforms: Different advertising platforms, like Google Ads or Facebook Ads, have different pricing structures and levels of competition, leading to variations in CPC.
- Bidding Strategy: You can set manual bids for specific keywords or use automated bidding strategies that adjust your bids based on various factors to optimize your clicks and budget.
- Ad Quality: Ads with higher relevance and quality scores on platforms like Google Ads can result in lower CPCs due to better ad placement and user engagement.
- Targeting: Targeting specific demographics, interests, or locations can also affect CPCs, as some audiences may be more expensive to reach due to higher competition.
Here are some tips to lower your CPC and get the most out of your advertising budget:
- Conduct keyword research: Choose relevant keywords with high search volume but moderate competition to find a sweet spot for cost and reach.
- Create high-quality ads: Write compelling ad copy and use relevant visuals to attract clicks and improve quality scores.
- Refine your targeting: Focus your audience targeting to avoid wasted clicks on irrelevant users.
- Experiment with different bidding strategies: Test manual and automated bidding strategies to see what works best for your goals and budget.
- Analyze and optimize: Regularly monitor your ad performance and make adjustments based on data insights to improve your overall ROI.
Quality Score
It's Google's rating of your ad's relevance and user experience for specific keywords, measured on a scale of 1 (poor) to 10 (excellent). A higher score means your ad is more likely to be shown, at a lower cost, to users searching for those keywords.
What factors affect Quality Score?
- Expected Click-Through Rate (CTR): Google estimates how likely someone is to click your ad when it appears for your chosen keywords. High relevance and compelling ad copy boost your CTR, leading to a better Quality Score.
- Ad Relevance: How well your ad matches the intent and meaning of the keyword user searches for. Relevant keywords, ad groups, and ad copy all contribute to a strong score.
- Landing Page experience: Does your landing page deliver on the promise of your ad? Relevant content, clear calls to action, and fast loading times improve user experience and Quality Score.
Why is it important?
- Lower Cost Per Click (CPC): A high Quality Score can earn you lower CPCs, meaning you pay less for each click on your ad. This translates to significant cost savings and campaign budget efficiency.
- Improved Ad Rank: Ads with higher Quality Scores are more likely to appear at the top of the search results page, increasing your visibility and click-through rate.
- Better Campaign Performance: Overall, a good Quality Score leads to a better user experience, potentially resulting in higher conversions and improved campaign ROI.
Ad Position and Impression Share
The higher your ad position, the more prominent it is, increasing the chances of users noticing and clicking on it. Generally, the top ad positions on the first page of the SERP garner the most clicks and website traffic.
A high impression share indicates your ad is frequently eligible to show, but it doesn't necessarily guarantee clicks or conversions. You could have a high impression share but a low ad position, meaning your ad is often eligible but might be buried lower on the page.
Conversion Rate and Cost Per Conversion
Conversion rate calculates the percentage of individuals who take a desired action after interacting with your ad or website. Did they download an ebook, subscribe to your newsletter, or make that coveted purchase? Conversion rate tells you how effectively your efforts are turning "lookers" into "takers."
Cost Per Conversion reveals the price you pay for each action taken. It's like the cost per brick for building your ideal customer bridge. A high CPC might not be alarming if conversions are frequent and valuable, but if the bridge takes forever to build with expensive bricks, something needs tweaking.
Content Marketing Metrics:
Content engagement (likes, shares, comments)
Time on page
Number of downloads or views for content assets (ebooks, videos, infographics)
Conversion rate for content-driven leads
Customer Acquisition and Retention Metrics:
Customer acquisition cost (CAC)
Customer lifetime value (CLV)
Churn rate (for subscription-based models)
Repeat purchase rate
Customer Engagement Metrics:
Customer satisfaction (Net Promoter Score, Customer Satisfaction Score)
Customer feedback and reviews
Social media sentiment analysis
Customer support response time and resolution rate
Return on Investment (ROI) Metrics:
Return on ad spend (ROAS)
Return on investment for specific campaigns or channels
Marketing contribution to overall business revenue
Mobile Metrics (for mobile apps and mobile marketing):
App downloads and installs
App retention rate
In-app engagement metrics (e.g., time spent in the app, in-app purchases)
Landing Page Metrics:
Landing page conversion rate
Click-through rate to landing pages
A/B testing results for landing page elements
Understanding the average revenue generated by a customer over their lifetime helps assess customer loyalty and long-term profitability.
Social Reach and Engagement
These metrics measure the number of people exposed to your social media content and interacting with it (likes, shares, comments).
Net Promoter Score (NPS)
NPS measures customer loyalty and advocacy by asking how likely they are to recommend your brand.
Brand Mentions and Sentiment
Tracking online mentions of your brand and their sentiment (positive, negative, neutral) provides insights into brand perception.
Click-through rate (CTR) for ads or email campaigns